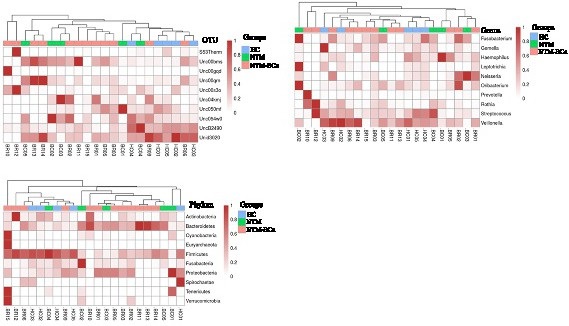
Fig. 5. Heatmaps and clustering of individual sputum microbiota at OTU, genus and phylum level. The heatmaps were generated based on the abundance of the top 10 Taxa. A minimum average abundance of 1% was considered to determine relative abundance at various taxonomic levels. HC: Healthy controls; NTM: Women with NTM lung disease only; NTM-BCa: Women with both NTM lung disease and breast cancer.